
FINANCIAL
Major Consolidated Financial Metrics (Actuals for Most Recent 5 Years)
*The figure below can be viewed by sliding left or right.
*The table below can be viewed by sliding left or right.
| FYE2022/3 | FYE2023/3 | FYE2024/3 | FYE2025/3 | FYE2026/3 | |
|---|---|---|---|---|---|
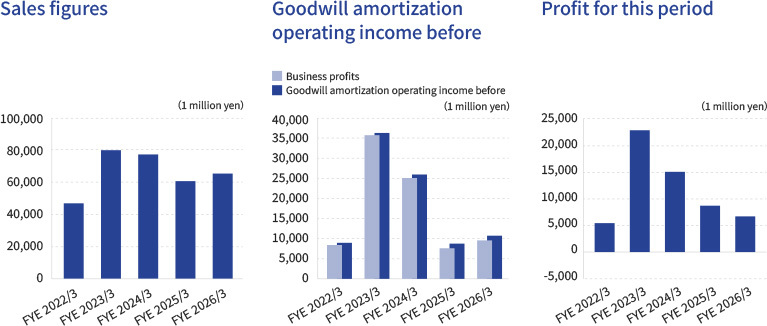
| Sales figures (1 million yen) |
46,592 | 80,015 | 77,472 | 60,574 | 65,468 |
| Business profits (1 million yen) |
8,417 | 35,789 | 25,170 | 7,615 | 9,573 |
| Goodwill amortization operating income before (1 million yen) |
9,091 | 36,553 | 26,047 | 8,769 | 10,750 |
| Current profits (1 million yen) |
8,595 | 35,933 | 26,004 | 8,448 | 9,944 |
| Profit for this period (1 million yen) |
5,396 | 22,977 | 15,117 | 8,645 | 6,716 |
| Profit for this period per share (EPS) (yen)※1 | 82.96 | 353.60 | 241.85 | 150.03 | 148.30 |
※1 : The Company conducted a 5-for-1 stock split of its common shares, effective October 1, 2025. Figures for periods up to the fiscal year ended March 2025 have been calculated on the assumption that the stock split was effected at the beginning of each fiscal year.
*The figure below can be viewed by sliding left or right.
*The table below can be viewed by sliding left or right.
| FYE2022/3 | FYE2023/3 | FYE2024/3 | FYE2025/3 | FYE2026/3 | |
|---|---|---|---|---|---|
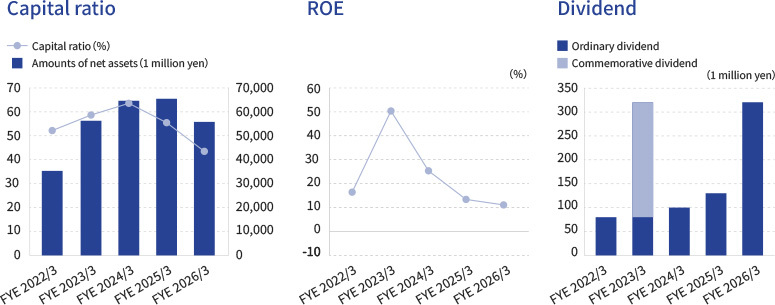
| Amounts of net assets (1 million yen) |
35,537 | 56,602 | 64,023 | 65,481 | 55,800 |
| capital ratio (%) | 52.2 | 58.7 | 63.6 | 55.5 | 43.5 |
| D/E ratio (multiple) | 0.37 | 0.25 | 0.15 | 0.54 | 1.04 |
| Amounts of net assets per share (BPS) (yen)※2 |
544.76 | 858.56 | 1,064.50 | 1,165.10 | 1,453.23 |
| Return on assets (ROA) (%) |
12.4 | 44.1 | 26.7 | 7.8 | 8.1 |
| Return on equity (ROE) (%) |
16.44 | 50.38 | 25.36 | 13.43 | 11.10 |
| Dividend amount per share (yen)[Pre-stock split equivalent] ※3 | 16[80] | 64[320]※1 | 20[100] | 26[130] | 64[320] |
※1 : Breakdown of dividends for FYE2023/3: Ordinary dividend: 16yen[80 yen on a pre-split basis], Commemorative dividend: 48yen[240 yen on a pre-split basis]
※2 : The Company conducted a 5-for-1 stock split of its common shares, effective October 1, 2025. Figures for periods up to the fiscal year ended March 2025 have been calculated on the assumption that the stock split was effected at the beginning of each fiscal year.
※3 : The Company conducted a 5-for-1 stock split of its common shares, effective October 1, 2025. Figures on a pre-split basis are presented in brackets [ ] in the table.