
FINANCIAL
Major Consolidated Financial Metrics (Actuals for Most Recent 5 Years)
*The figure below can be viewed by sliding left or right.
*The table below can be viewed by sliding left or right.
| FYE2020/3 | FYE2021/3 | FYE2022/3 | FYE2023/3 | FYE2024/3 | |
|---|---|---|---|---|---|
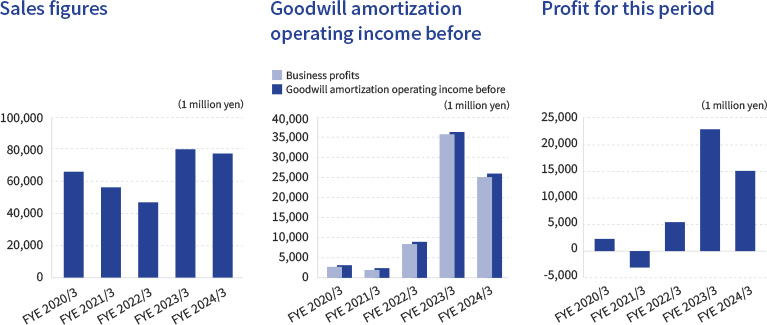
| Sales figures (1 million yen) |
66,596 | 57,378 | 46,592 | 80,015 | 77,472 |
| Business profits (1 million yen) |
2,741 | 1,946 | 8,417 | 35,789 | 25,170 |
| Goodwill amortization operating income before (1 million yen) |
3,459 | 2,613 | 9,091 | 36,553 | 26,047 |
| Current profits (1 million yen) |
2,995 | 3,020 | 8,595 | 35,933 | 26,004 |
| Profit for this period (1 million yen) |
2,292 | ▲3,035 | 5,396 | 22,977 | 15,117 |
| Profit for this period per share (EPS) (yen)※1 | 176.26 | ▲233.43 | 414.82 | 1,767.99 | 1,209.24 |
※1 : The above metrics were created on the basis of figures found in the securities report.
*The figure below can be viewed by sliding left or right.
*The table below can be viewed by sliding left or right.
| FYE2020/3 | FYE2021/3 | FYE2022/3 | FYE2023/3 | FYE2024/3 | |
|---|---|---|---|---|---|
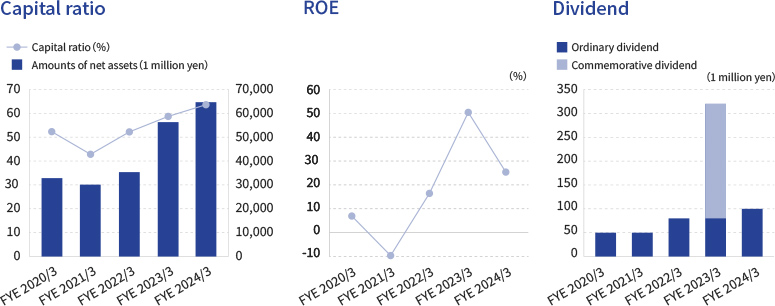
| Amounts of net assets (1 million yen) |
33,001 | 30,287 | 35,537 | 56,602 | 64,023 |
| capital ratio (%) | 52.3 | 42.8 | 52.2 | 58.7 | 63.6 |
| D/E ratio (multiple) | 0.54 | 0.78 | 0.37 | 0.25 | 0.15 |
| Amounts of net assets per share (BPS) (yen)※1 |
2,537.64 | 2,322.61 | 2,723.79 | 4,292.78 | 5,322.49 |
| Return on assets (ROA) (%) |
5.0 | 4.5 | 12.4 | 44.1 | 26.7 |
| Return on equity (ROE) (%) |
6.95 | ▲9.61 | 16.44 | 50.38 | 25.36 |
| Dividend amount per share (yen) | 50 | 50 | 80 | 320※2 | 100 |
※1 : The above metrics were created on the basis of figures found in the securities report.
※2 : Breakdown of dividends for FYE2023/3: Ordinary dividend: 80 yen; Commemorative dividend: 240 yen