
STOCK INFO
Stock Summary
| Corporate name | Mitsui Matsushima Holdings Co., Ltd. |
|---|---|
| Head Office | Otemon Pine Bldg. 11F 1-1-12 Otemon Chuo-ku, Fukuoka 810-8527 TEL:092-771-2171 (general) FAX:092-726-3267 |
| Established | |
| Listed Stock Exchanges | Tokyo Stock Exchange Prime Market; Fukuoka Stock Exchange (Stock Code 1518) |
| Financial Year | Until March 31 of the following year from April 1 every year |
| Annual Meeting of Stockholders | June every year |
| Share Unit | 100 shares |
| Capital | ¥8,571,795,866 |
| Number of Shareholders | 11,425 (as of September 30, 2024) |
| Total Number of Shares Trade of Outstanding | 13,064,400 shares |
| Total Number of Authorized Shares | 30,000,000 shares |
Major Shareholders
(2024 the end of March)
*The table below can be viewed by sliding left or right.
| Shareholders | Number of stocks held (100 shares) | Investment ratio (%) |
|---|---|---|
| The Master Trust Bank of Japan, Ltd.(Account in Trust) | 16,198 | 14.03 |
| Minami-Aoyama Fudosan Co., Ltd. | 11,554 | 10.01 |
| Fortis Co., Ltd. | 10,566 | 9.15 |
| S-GRANT. CO., LTD. | 7,999 | 6.93 |
| individual stock ownership | 4,851 | 4.20 |
| Sumitomo Mitsui Banking Corporation | 3,318 | 2.87 |
| The Juhachi-Shinwa Bank, Ltd. | 3,268 | 2.83 |
| STATE STREET BANK AND TRUST COMPANY 505223 | 2,903 | 2.51 |
| Custody Bank of Japan, Ltd.(Account in Trust) | 2,591 | 2.24 |
| STATE STREET BANK AND TRUST COMPANY 510355 | 1,848 | 1.60 |
(Notes)1.Treasury stock of 1,518,690 shares is excluded in calculating the shareholding ratio.
2.The treasury stock includes 198,000 shares held by Custody Bank of Japan, Ltd.(“E” trust account ) for the “Board Benefit Trust (BBT)” plan, which were decided to beintroduced in the company at the 162nd Annual General Meeting of Shareholders held onJune 22, 2018.
Stock Distribution by Owner
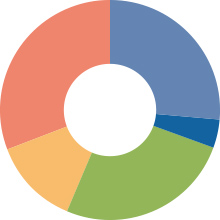
*The table below can be viewed by sliding left or right.
| Owner | Shareholders | Shares | Ratio |
|---|---|---|---|
| ■ Financial institution | 23 | 3,480,850shares | 26.64% |
| ■ Securities company | 33 | 527,945shares | 4.04% |
| ■ Nonfinancial company, etc. | 91 | 3,384,105shares | 25.90% |
| ■ Foreign company, etc. | 124 | 1,663,922shares | 12.74% |
| ■ Individuals, others | 11,154 | 4,007,578shares | 30.68% |
| Total | 11,425 | 13,064,400shares | 100.00% |
※as of September 30, 2024
Stock Distribution by Number of Shares Owned
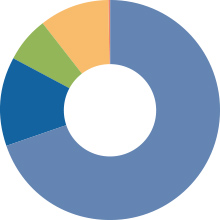
*The table below can be viewed by sliding left or right.
| Number of Shares Owned | Shareholders | Shares | Ratio |
|---|---|---|---|
| ■ 100,000 shares or more | 20 | 9,111,084shares | 69.74% |
| ■ 10,000 shares or more | 55 | 1,723,176shares | 13.19% |
| ■ 1,000 shares or more | 436 | 877,144shares | 6.71% |
| ■ 100 shares or more | 8,155 | 1,329,490shares | 10.18% |
| ■ Less than 100 shares | 2,759 | 23,506shares | 0.18% |
| Total | 11,425 | 13,064,400shares | 100.00% |
※as of September 30, 2024
Stock Distribution by Geography
*The figure below can be viewed by sliding left or right.

※as of September 30, 2024